
|
Search | FAQ | US Titles | UK Titles | Memories | VaporWare | Digest | |||||||
| GuestBook | Classified | Chat | Products | Featured | Technical | Museum | ||||||||
| Downloads | Production | Fanfares | Music | Misc | Related | Contact | ||||||||
| The Voyager Spacecraft Interstellar Record | ||||||||||||||
I've always been fascinated with the Voyager Interstellar Record, perhaps because it's somewhat similar to a CED in being a grooved record containing nearly two hours of analog recordings of images and sounds of Earth. But the Voyager record is not a CED, as all the information on the disc is recorded in the audio frequency range, and the disc is designed to spin at only 16 2/3 RPM requiring 12 seconds to play back a color image. By comparison, a CED has a frequency range of 3 MHz, spins at 450 RPM, and will play back 360 video frames in the span of 12 seconds. I've gotten several inquiries lately asking if this disc is an early form of the CED, possibly because the History Channel has recently started broadcasting a segment about it on their History's Lost & Found series where it is described as:
"... a two hour metal record containing images, music, and other sounds and greetings. A multimedia presentation for the ages." ... "All the information was encoded onto discs which were coated in copper and gold to protect them through the ages. Each record was accompanied by a stylus and a cartridge, and most importantly, a set of instructions on how to play it."
This might superficially sound like the metal-plated CED's RCA was still experimenting with when the Voyager 1 and 2 spacecraft were launched in 1977, but those early CED's only played 1 hour per disc, and the metal coating was aluminum, with the CED base material still being plastic. The Voyager records are actually gold-plated copper mothers of regular 33 RPM audio LP's, designed to spin at half speed to double the play back time with a slight loss in fidelity. This is similar to the production process used for CED's, wherein positive mothers were used to make negative stampers, which were then used to press the consumer discs. The Voyager discs were left in the form of metal mothers for the sake of longevity, estimated to be a billion years or more in the near vacuum of interstellar space. This is a good thing, as it's going to be at least 60,000 years before either of the Voyager spacecraft even come close to another star.
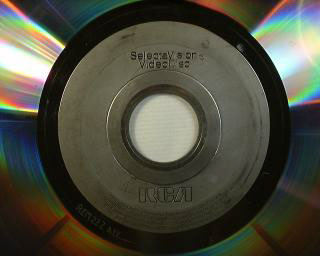
The following illustrations provide a comparison of the 1977 version of the RCA CED to the Voyager record. RCA was actually involved with the early production of the Voyager record, and CBS performed the function of cutting the lacquer masters from which the copper mothers were made. Herbert Schlosser, president of NBC in 1977 also assisted with the Voyager record project, and he later became Executive Vice President for VideoDisc Programming at RCA.
1977 Metallized RCA VideoDisc |
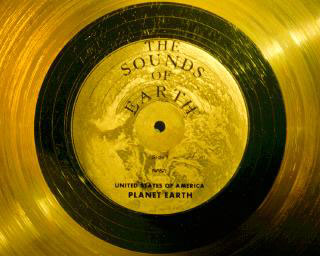
Voyager Interstellar Record |
 |
 |
 |
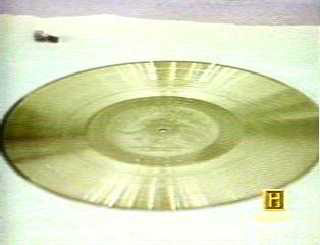 |
The illustration at the top of this page is the gold-plated aluminum cover used to enclose the Voyager records. The etchings on the cover provide instructions for playing the record to whoever finds it. The Voyager record is secured in plain view on the outside of the Voyager Spacecraft with a spider mounting to which is also affixed the stylus cartridge used to play the disc. The record itself is actually made of two copper mothers bonded back-to-back. The side that faces inward towards the spacecraft is best protected, and contains all 122 images included on the record, as well as human and cetacean greetings, the sounds of earth, and a third of the music selections. The outer side consists entirely of music selections. NASA's Golden Record Page provides a list of the contents along with the ability to see and listen to much of the material. Note that the NASA write-up mentions only 115 images because they miscounted their listing by one and don't include the six images of text, the first two displaying President Carter's greeting and the last four displaying the names of Congress members on committees relevant to NASA. They also changed the original image of Cathy Rigby to another gymnast due to copyright issues.
The late Carl Sagan headed the team that chose the contents of the Voyager record. He was also responsible for the design of the plaques included with the Pioneer 10 and 11 Spacecraft and the LAGEOS 1 Satellite. A book titled "Murmers of Earth" authored by Sagan and other members of his team was published in 1978 and provides a recounting of the effort that went into the Voyager record. In 1992 a soft-cover edition of this book was published including a pair of CD-ROMs providing the contents of both sides of the Voyager record. The stand-alone book and the CD-ROM package are both out of print, but a web search should turn up a copy of one or the other. A couple of areas the "Murmers of Earth" book doesn't provide a thorough explanation of are the mathematical interpretation of the symbols on the record cover and the reconstruction of color images from signals in the audio frequency range. The book was published in the infancy of the personal computer, so the authors' may have not wanted to go into the details of binary arithmetic and RGB color interpretation that people are more comfortable with today. Since this is the sort of thing that interests me, I've provided a detailed explanation of each of the illustrations on the record cover below, which will provide an understanding of how the Voyager record is meant to be played back.
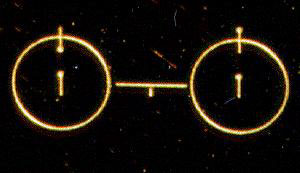 This illustration on the lower right of the Voyager record cover could be considered the "Rosetta Stone" of the record, as it provides the key to interpreting the remaining cover illustrations. This illustrates the hyperfine transition of the hydrogen atom where it changes between its two lowest states. The time interval for this is a mathematical constant equal to 0.7 billionths of a second, or more precisely 7.04024183647E-10 seconds. The 1 between the two states indicates the length of the transition should be equal to a binary 1. The binary numbering system, with just two symbols, 0 and 1, is the simplest numbering system, and is more likely to be understood by other civilizations than our decimal system adopted simply because humans have 10 fingers. With hydrogen being the most abundant element in the galaxy, any advanced civilization likely to encounter the Voyager should be able to interpret the meaning of this diagram.
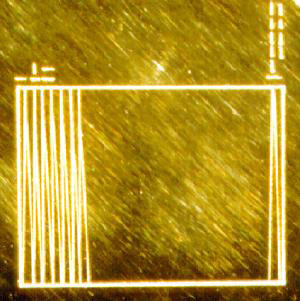
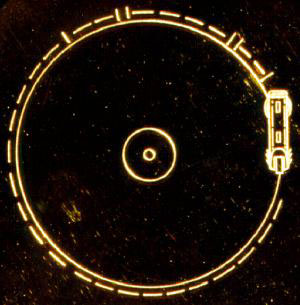 This is a top-down view of the Voyager record showing the stylus cartridge in place to play the disc. The position of the cartridge implies the record groove is to be played from the outside in. The symbols around the periphery of the record are a binary representation of the time required for one revolution of the record where a binary 0 is represented by a dash and a binary 1 is represented by the same vertical symbol used with the hydrogen transition above. Since leading 0's are meaningless in the binary numbering system, the number would be read off in a counter clockwise direction starting above the stylus cartridge. This also implies the record is supposed to spin clockwise relative to a stationary stylus, as that's the way the illustration needs to move to read off the binary number. The number around the periphery is 100110000110010000000000000000000 which converts to 5,113,380,864 in decimal. Multiplying this by 7.04024183647E-10 seconds yields 3.5999 seconds, the length of time for one rotation of the record.
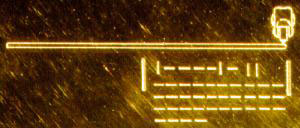 This is a side view of the record and stylus cartridge, with two large bars enclosing a binary number indicating the length of time required to play one side of the record. Doing the math again, we have 1000010110000000000000000000000000000000000 which converts to 4,587,025,072,128 in decimal. Multiplying by 7.04024183647E-10 seconds yields 3229.377 seconds, or about 53.8 minutes to play one side.
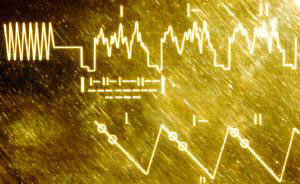 These waveform representations of the picture signal recorded in the groove provide an explanation for how the images are to be constructed. Someone analyzing the signal on the record would be able to recognize the image portion by similar looking groups of waveforms, with each group preceded by the symmetrical waveform seen in the top left corner of this picture. Each of these groups would be further subdivided into 512 individual signals, the first three of which are shown here labeled in binary notation as 1, 10, and 11 (decimal 1, 2, and 3). Just below the waveform drawing is a conceptual drawing of what they represent, again labeled 1, 10, and 11. The conceptual drawing indicates that each of the three signals represents a "line" of the final image with each line being drawn in a staggered, non-overlapping fashion. All 512 signals taken together constitute a single image. This staggered line image is the same way television images are drawn by the electron gun inside the CRT, except in the case of modern TV the lines are arranged horizontally and interlacing is used. There is also a binary number of 101101001100000000000000 under signal 1 which converts to 11,845,632 in decimal. Multiplying this by the constant of 7.04024183647E-10 seconds yields 0.0083396 seconds. So it takes about 8 milliseconds to draw one line of an image. It might be a considerable jump for someone to look at this one portion of the record cover and interpret what the image waveforms are supposed to be, but the two images below it provide further reinforcement of the desired interpretation.
 This drawing expands on the concepts presented in the waveform drawing by showing what a complete image would look like. There's a binary number 1000000000 drawn vertically above the last line of the image. This converts to 512 in decimal and indicates that the image consists of 512 lines, which would concur with the 512 similar signals within each waveform as described above. There is also a binary number of 10000 at the left end of the picture that converts to decimal 16. The interpretation of this seems somewhat cryptic, but it means that there are 16 levels of gray within each line. In other words the image quality in terms of grayscale is about equal to a photocopy of a photograph. The image quality in terms of resolution would be somewhat less than a photocopy as it equals about 500 dots along each line of the image. Thus each image has about the same number of dots along each line as there are lines in the complete image. If you think in terms of pixels rather than lines, this ratio results in square pixels.
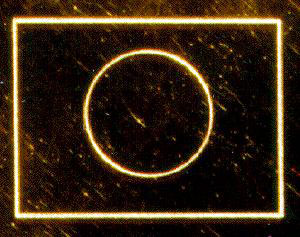 This picture of a circle is the first image recorded on the record. It is intended for calibration purposes to ensure the signal on the disc is being decoded properly, and the right ratio of horizontal to vertical height is used in picture reconstruction. For example, if someone decoded this picture and the circle instead looked like an oval that was wider than it was tall, they would probably guess that they need to draw the picture lines closer together.
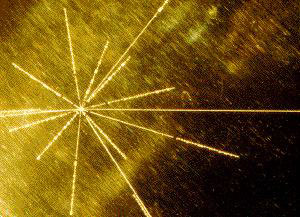 This picture has nothing to do with interpreting the disc contents, but rather is a pulsar map indicating the solar system from which the Voyager spacecraft originated. The cover of the Voyager record also contains an ultra-pure source of Uranium-238 to serve as a radioactive clock for determining the record's age. This same pulsar map as well as hydrogen atom drawing were also included on the Pioneer 10 and 11 Plaques. Each pulsar has its own distinct and rapid pulsing radio frequency that is very slowly changing with absolute linearity. It's likely that other civilizations of sufficient advancement will be familiar with these and their rates of change. The pulsar map shows fourteen pulsars and their directions from the sun along with the current frequency of the pulsar in binary notation. The horizontal line extending to the right with no binary number attached is a pointer from the sun to the center of the galaxy.
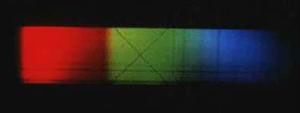 The Voyager record contains about 20 color pictures, and at first it might seem a mystery how these could be extracted from 16 levels of gray. This picture of the solar spectrum is the first color image on the record, and someone recovering the image would note that it is actually recorded on the record three times in succession, with only the gray levels being different between the three recordings. The black absorption lines extending through the rainbow pattern are distinct for any G2 star like our own sun. A civilization familiar with solar spectroscopy should be able to recognize this as the red, green, and blue portion of a solar spectrum. They should then realize that the color image can be reconstructed by making a composite of the three images, one on top of the other, with the 16 shades of gray being interpreted as 16 shades of red, green, or blue in each layer of the image. By adjusting the color values assigned to each shade of gray, they will be able to reconstitute this known image of a solar spectrum and then use those color settings to properly view the remaining color images on the record. This is the same RGB technique used with present-day computers to determine exact colors. Sixteen levels of gray corresponds to 4 bits (2 to the fourth power), so the color images on the Voyager record have a combined color depth of 12 bits which permits a total of 4096 colors (2 to the twelfth power). By comparison, a common color setting for web browsing is 16-bit or 65,536 colors, and most computers manufactured today can do 32-bit color.